Guides
How the USDA Plant Hardiness Zone Map decides what blooms on a US garden trip
The USDA Plant Hardiness Zone Map sets winter cold, not bloom dates, so match its half-zone bands to frost data before booking a garden trip.
What to take away
- The USDA Plant Hardiness Zone Map reports average annual extreme minimum winter temperature. It never reports a bloom date.
- Read the letter with the number. Zone 7a and 7b sit 5°F apart and can both occur inside one metro area.
- Turn a zone into a travel date with NOAA frost normals and the garden's own peak week.
- Follow the gradient north and uphill in spring to catch two or three peak weeks on one trip.
- A warmer half zone raises survival odds for marginal plants. It does not move a peak week by a set number of days.
How the map is built and what the 2023 revision changed
The map is a grid of average annual extreme minimum winter temperatures, built from decades of station records and smoothed across terrain between them. It answers one question: how cold does a typical winter get here?
The 2023 revision moved roughly half the country into a warmer half zone, about 5°F at the cold extreme, as the USDA announcement describes. The rest held steady.
Half-Zone Shift in 2023
5°F at the cold extreme
Roughly half the country shifted warmer
The rest held steady
A marginal plant may now survive winter
Half a zone is not a promise that every spring starts earlier. It means a marginal plant may now survive a winter where it once died, which changes what a collection can hold.
Reading a zone number before you match it to a bloom window
Reading a zone number
- Look up the zone for the garden itself, not for the nearest big city.
- Note the letter. The a and b halves split each zone into 5°F bands.
- Check elevation and distance from open water, which both shift results inside one zone.
- Ask the garden for its typical last frost date.
- Ask for its typical peak week and how far that week has moved in ten years.
Zone-to-Bloom Window Checklist
- Confirm the zone for the garden itself, not just the city
- Check the a or b half, not only the number
- Find the average last frost date for that location
- Note elevation and coastal influence
- Check whether the garden sits in an urban heat island
- Compare the zone to the plants the garden is known for
The How to Use the Maps page is the official guide, and it warns that conditions vary inside one zone.
Coastal fog, urban heat and a slope can put both halves of one zone within a short drive. Western North Carolina runs colder than the coastal plain at the same latitude. Three garden cities show what that gap does to a trip date.
What half-zone warming does to bloom timing
Half a zone of warming does not shift a bloom window by weeks on its own. It changes survival odds for marginal plants and can nudge early species a few days earlier in mild years.
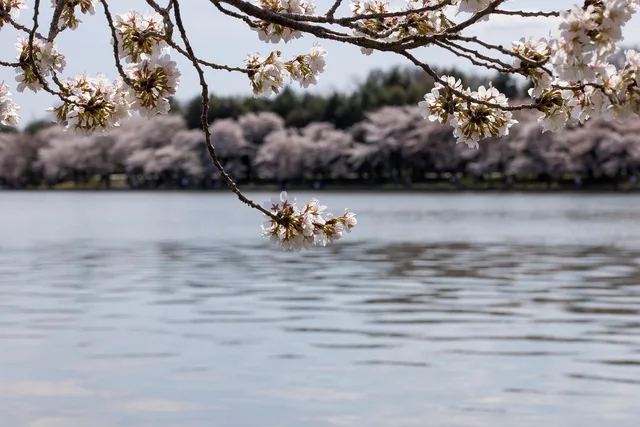
Cherries, magnolias and early bulbs follow accumulated warmth rather than the calendar. A mild winter advances that build-up. One late cold snap erases it.
So carry a range, not a date. Ask the garden when its signature plant peaks and how far that week has moved in a decade.
Zone bands across five states, coast to interior
Zone bands across five states
| State | Zone range | What the range means for a trip | Gardens that show it |
|---|---|---|---|
| California | 5a to 11a | Winter bloom on the coast, summer heat inland | San Francisco Botanical Garden, Huntington Botanical Gardens, Ruth Bancroft Garden |
| Oregon | 4b to 9b | Spring arrives weeks apart between valley and plateau | Portland Japanese Garden, Lan Su Chinese Garden, The Oregon Garden |
| North Carolina | 5b to 8b | Spring walks inland from the coast over several weeks | Sarah P. Duke Gardens, JC Raulston Arboretum, Biltmore gardens |
| Missouri | 5b to 7b | Narrow band, volatile spring, late freezes | Missouri Botanical Garden, Powell Gardens, Springfield Botanical Gardens |
| New York | 3b to 7b | Two seasons in one state, the city earlier than upstate | New York Botanical Garden, Brooklyn Botanic Garden, Cornell Botanic Gardens |
A wide zone range only matters if the collection justifies the travel. The types of public garden destination that reward a long trip are chosen on collections and season, not on a number.
Zone range is a filter for survival. It does not pick your week.
Example: three stops with the same winter cold and different peak weeks
Coastal North Carolina sits at 7b to 8a, southeastern Missouri at 7a, and coastal New York at 7a to 7b. Winter cold at the three stops is close. Peak week is not.
Three stops, same winter cold
| Stop | Typical zone | Signature bloom | Typical peak week |
|---|---|---|---|
| Coastal North Carolina, Wilmington area | 7b to 8a | Azalea and dogwood | Late March to early April |
| Southeastern Missouri, Cape Girardeau area | 7a | Redbud and dogwood | Early to mid April |
| Coastal New York, Bronx and Brooklyn | 7a to 7b | Cherry | Mid to late April |
Three stops with the same winter cold
- Start on the coastal plain in the last week of March.
- Move north and inland for redbud and dogwood in early April.
- Finish in New York for cherry peak, two to three weeks after the coast.
Coastal New York packs several collections into one transit system, so timing inside the city matters. How New York Botanical Garden and Brooklyn Botanic Garden differ by season explains why the two can peak a week or two apart.
Matching NOAA frost normals to a zone
NOAA publishes the normals, frost dates and seasonal outlooks that a zone number leaves out. Blend the two and you get a usable week.
These last frost dates are typical values, not fixed dates.
Matching NOAA frost normals
| Location | Zone | Normal last frost | Best window for the signature bloom |
|---|---|---|---|
| Wilmington, NC | 8a | Early to mid March | Late March to early April |
| Cape Girardeau, MO | 7a | Mid April | Early to mid April, before the last frost |
| New York, NY | 7a to 7b | Early April | Mid to late April |
NOAA climate publishes the normals and outlooks behind those windows.
Where the zone map stops being useful
The map is a winter survival tool. It says nothing about summer heat, rainfall or soil, which drive most of what a summer garden shows.
It also misses microclimate at garden scale. A wall, a slope or a lake shore can shift conditions by half a zone within a few hundred yards.
Chill hours are the other gap, since some plants need a set number of cold hours to flower well.
Treat the zone as one input. When you start building a 2027 garden itinerary, lock the peak week first and the lodging second.
Common questions
Does the USDA zone map tell me when plants bloom?
No. It reports average annual extreme minimum winter temperature. Bloom timing follows accumulated warmth, frost dates and the plant itself.
What changed in the 2023 update?
About half the country shifted into a warmer half zone and the rest stayed put, based on a longer station record.
Can I compare two gardens in different states by zone alone?
Only for winter hardiness. Two gardens in the same zone can peak weeks apart because of latitude, elevation and coastal influence.
Where do I find the official zone for a specific garden?
Use the interactive USDA map for the garden's address or ZIP code, then read the a or b half. Most gardens post their peak week on their own site.